Supervised ML in R with Tidymodels

Raimundo Sanchez, Ph.D.

Introduction to Machine Learning

Machine learning models primarily seek to uncover meaningful patterns within a set of input features or characteristics \(\vec{x}\), aiming to predict or understand an output variable \(y\).

\[ y = f(\overrightarrow{x}) \]

The “Black-Box” Perspective

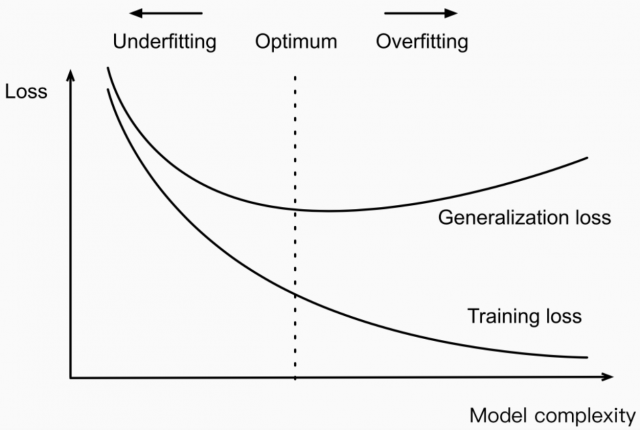
Model Complexity and Overfitting

Machine learning models often come equipped with numerous parameters, offering the flexibility to capture intricate data relationships. However, this can lead to a common challenge in machine learning known as overfitting.

Data Sampling

Sampling techniques, including data splitting and cross-validation, are essential for avoiding overfitting.

Types of Machine Learning

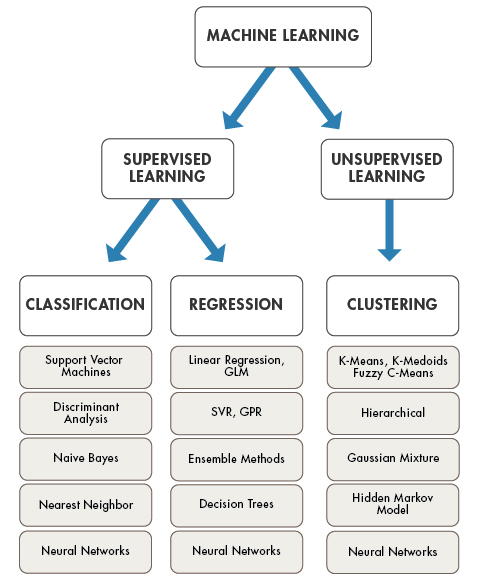
Supervised Learning

In supervised learning, the algorithm learns from a labeled dataset, pairing input data \(\vec{x}\) with corresponding output \(y\).

  • Classification: Models classify input data into predefined categories or classes.
  • Regression: Models predict continuous numeric values.

Unsupervised Learning

  • Unsupervised learning algorithms operate with unlabeled data.
  • Their primary aim is to uncover patterns or relationships within the input data.
  • A key task in unsupervised learning is Clustering

Tidymodels: A powerful wrapper for ML packages in R

Consistent and tidy approach to building, and evaluating ML models.

library(tidymodels)
── Attaching packages ────────────────────────────────────── tidymodels 1.1.0 ──
✔ broom        1.0.4     ✔ rsample      1.1.1
✔ dials        1.2.0     ✔ tune         1.1.1
✔ infer        1.0.4     ✔ workflows    1.1.3
✔ modeldata    1.1.0     ✔ workflowsets 1.0.1
✔ parsnip      1.1.0     ✔ yardstick    1.2.0
✔ recipes      1.0.6     
── Conflicts ───────────────────────────────────────── tidymodels_conflicts() ──
✖ scales::discard() masks purrr::discard()
✖ dplyr::filter()   masks stats::filter()
✖ recipes::fixed()  masks stringr::fixed()
✖ dplyr::lag()      masks stats::lag()
✖ yardstick::spec() masks readr::spec()
✖ recipes::step()   masks stats::step()
• Learn how to get started at https://www.tidymodels.org/start/

NYC Flight Data for Supervised Machine Learning

library(nycflights13)

glimpse(flights)
Rows: 336,776
Columns: 19
$ year           <int> 2013, 2013, 2013, 2013, 2013, 2013, 2013, 2013, 2013, 2…
$ month          <int> 1, 1, 1, 1, 1, 1, 1, 1, 1, 1, 1, 1, 1, 1, 1, 1, 1, 1, 1…
$ day            <int> 1, 1, 1, 1, 1, 1, 1, 1, 1, 1, 1, 1, 1, 1, 1, 1, 1, 1, 1…
$ dep_time       <int> 517, 533, 542, 544, 554, 554, 555, 557, 557, 558, 558, …
$ sched_dep_time <int> 515, 529, 540, 545, 600, 558, 600, 600, 600, 600, 600, …
$ dep_delay      <dbl> 2, 4, 2, -1, -6, -4, -5, -3, -3, -2, -2, -2, -2, -2, -1…
$ arr_time       <int> 830, 850, 923, 1004, 812, 740, 913, 709, 838, 753, 849,…
$ sched_arr_time <int> 819, 830, 850, 1022, 837, 728, 854, 723, 846, 745, 851,…
$ arr_delay      <dbl> 11, 20, 33, -18, -25, 12, 19, -14, -8, 8, -2, -3, 7, -1…
$ carrier        <chr> "UA", "UA", "AA", "B6", "DL", "UA", "B6", "EV", "B6", "…
$ flight         <int> 1545, 1714, 1141, 725, 461, 1696, 507, 5708, 79, 301, 4…
$ tailnum        <chr> "N14228", "N24211", "N619AA", "N804JB", "N668DN", "N394…
$ origin         <chr> "EWR", "LGA", "JFK", "JFK", "LGA", "EWR", "EWR", "LGA",…
$ dest           <chr> "IAH", "IAH", "MIA", "BQN", "ATL", "ORD", "FLL", "IAD",…
$ air_time       <dbl> 227, 227, 160, 183, 116, 150, 158, 53, 140, 138, 149, 1…
$ distance       <dbl> 1400, 1416, 1089, 1576, 762, 719, 1065, 229, 944, 733, …
$ hour           <dbl> 5, 5, 5, 5, 6, 5, 6, 6, 6, 6, 6, 6, 6, 6, 6, 5, 6, 6, 6…
$ minute         <dbl> 15, 29, 40, 45, 0, 58, 0, 0, 0, 0, 0, 0, 0, 0, 0, 59, 0…
$ time_hour      <dttm> 2013-01-01 05:00:00, 2013-01-01 05:00:00, 2013-01-01 0…

Data preparation

Our primary task will involve predicting whether an aircraft will experience a delay of more than 15 minutes upon arrival.

flight_data <- 
  flights %>% 
  mutate(
    arr_delay = ifelse(arr_delay >= 15, "late", "on_time"),
    date = lubridate::as_date(time_hour)
  ) %>% 
  select(dep_time, flight, origin, dest, air_time, distance, 
         carrier, date, arr_delay, time_hour) %>% 
  na.omit() %>% 
  mutate_if(is.character, as.factor)  %>% 
  sample_n(10000)

Key Components of the Tidymodels Package

Model Specifications

  • Tidymodels offers a diverse selection of machine learning algorithms.
  • Many of these algorithms require parameter, mode and engine definitions.
  • Tidymodels serves as a convenient wrapper for various machine learning libraries in R.

Decision Trees

  • Segment data by input features, guiding decisions through a tree-like structure.
tree_model <- 
  decision_tree(tree_depth = 10, min_n = 5) %>%
  set_mode("classification") %>%
  set_engine("rpart")
  • Pros: Interpretability, and ease of handling non-linear data.
  • Cons: Bias towards the majority class in imbalanced datasets.

Logistic Regression

  • Models the probability of an instance belonging to a specific class with a linear model.
logistic_model <- 
  logistic_reg() %>%
  set_mode("classification") %>%
  set_engine("glm")
  • Pros: High interpretability, computational efficiency, resistance to overfitting.
  • Cons: Linearity assumption limit its performance on complex, non-linear data.

Naive Bayes

  • Applyies Bayes’ theorem to calculate the probability of a class given a set of feature values
bayes_model <- 
  naive_Bayes() %>%
  set_mode("classification") %>%
  set_engine("klaR")
  • Pros: Fast training and prediction times, especially on high-dimensional data.
  • Cons: The “naive” assumption of feature independence can limit its performance.

Multi-layer Perceptron

  • Neural network model consisting of multiple layers of interconnected functions.
mlp_model <- 
  mlp(hidden_units = 10) %>%
  set_mode("classification") %>%
  set_engine("nnet")
  • Pros: Modeling intricate, non-linear relationships in data.
  • Cons: Susceptible to overfitting, low interpretability.

Random Forest

  • Ensemble machine learning model that combines multiple decision trees.
randforest_model <- 
  rand_forest(trees = 15) %>%
  set_mode("classification") %>%
  set_engine("ranger")
  • Pros: High accuracy, resistance to overfitting, handle high dimensional data.
  • Cons: Low interpretability and computationally expensive.

K-nearest Neighbors

  • Determines the class of a data point by considering the classes of its k-nearest neighbors
knn_model <- 
  nearest_neighbor(neighbors  = 5) %>%
  set_mode("classification") %>%
  set_engine("kknn")
  • Pros: Easy to explain, capture complex relationships.
  • Cons: Computationally intensive, doesn’t handle high-dimensional data.

Support Vector Machines

  • Identifies a decision boundary, known as a hyperplane, to separate data into different classes.
svm_model <- 
  svm_poly(degree = 3) %>%
  set_mode("classification") %>%
  set_engine("kernlab")
  • Pros: Handling high-dimensional data and is robust against overfitting.
  • Cons: Computationally demanding.

Data Sampling

Tidymodels provides a diverse set of techniques for data sampling.

# we generate one single split of our data, 75% training set and 25% test set
data_split <- initial_split(flight_data, prop = 3/4)

# Create data frames for the two sets:
train_data <- training(data_split)
test_data  <- testing(data_split)

# we can also generate several splits, also known as v-fold cross validation
cv <- vfold_cv(train_data, v = 5)

Recipes

Powerful tool for explicitly defining the relationship between dependent \(y\) and independent variables \(\overrightarrow{x}\)

# simple recipe
flights_rec_simple <- 
  recipe(arr_delay ~ dep_time + distance + time_hour, data = train_data) 

# complex recipe including preprocessing steps
flights_rec <- 
  recipe(arr_delay ~ ., data = train_data) %>% 
  update_role(flight, time_hour, new_role = "ID") %>% 
  step_date(date, features = c("dow", "month")) %>%               
  step_holiday(date, 
               holidays = timeDate::listHolidays("US"), 
               keep_original_cols = FALSE) %>% 
  step_dummy(all_nominal_predictors()) %>% 
  step_zv(all_predictors())

Workflows

Workflows bring together the recipe and the model specification into a single coherent structure.

# create a workflow for our problem
wf_nycflights <- 
  workflow() %>%
  add_recipe(flights_rec) %>%
  add_model(tree_model)

# fit our workflow with initial data split
flights_fit <-
  wf_nycflights %>%
  fit(data = train_data)

# run our workflow with cross validation splits
flights_cv <-
  wf_nycflights  %>%
  fit_resamples(cv)

Metrics

You can easily calculate and compare model performance metrics to evaluate the quality of your models.

 flights_fit %>%
  augment(test_data) %>%
  roc_curve(truth = arr_delay, .pred_late) %>%
  autoplot()

Metrics Cross-validation

 flights_cv %>%
   collect_metrics()
# A tibble: 2 × 6
  .metric  .estimator  mean     n std_err .config             
  <chr>    <chr>      <dbl> <int>   <dbl> <chr>               
1 accuracy binary     0.773     5 0.00384 Preprocessor1_Model1
2 roc_auc  binary     0.650     5 0.00782 Preprocessor1_Model1

Hyperparameter Tuning

Tidymodels simplifies the hyperparameter tuning process, making it more accessible and efficient for model optimization.

tune_spec <-
  decision_tree(
    cost_complexity = tune(),
    tree_depth = tune()
  ) %>%
  set_engine("rpart") %>%
  set_mode("classification")

tree_grid <- grid_regular(cost_complexity(),
                          tree_depth(),
                          levels = 5)